Fossil
Seafloor Spreading Rates
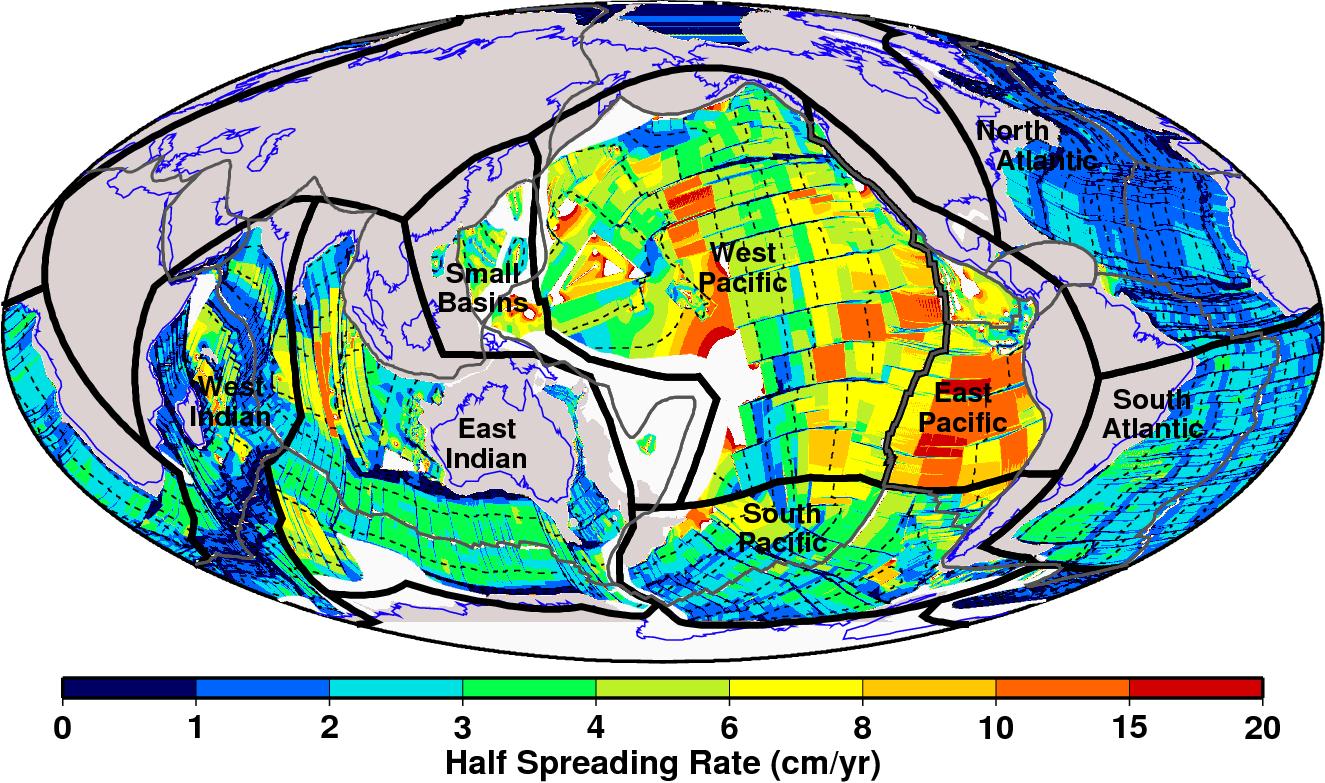
Conrad and Lithgow-Bertelloni [2007] calculated
age gradients of seafloor age map of Muller et al., [J. Geophys. Res., 102, 3211-3214,1997] to
determine the fossil half-spreading rates shown in the above figure (Fig. 1
from CLB07). By averaging theses rates over each of the defined ocean basins,
we estimate average preserved fossil spreading rates (Fig. 2 from CLB07), total
preserved spreading lengths (Fig. 3 from CLB07), and a lower bound on past
lithosphere production rates (Fig. 4 from CLB07). We also estimate these
quantities for the entire globe, both with and without the reconstructed
Farallon plate (which has largely subducted beneath the Americas) The
calculated spreading rates, lengths, and production rates, are available for
download:
Average Preserved
Half-Spreading Rates: [Ascii Format] [Excel Format]
Total Preserved Spreading Lengths: [Ascii Format] [Excel Format]
Minimum Lithosphere
Production Rates: [Ascii Format] [Excel Format]
The following abbreviations apply in these
files:
AGE
= Seafloor ages in millions of years
GLOBAL
= Global average for the present-day seafloor
R.FAR
= Global average including the reconstructed Farallon plate
E.PAC
= East Pacific W.PAC
= West Pacific
S.PAC
= South Pacific S.BAS
= Small Basins
E.IND
= East Indian W.IND
= West Indian
S.ATL
= South Atlantic N.ATL
= North Atlantic
Citation: Please cite the
following paper when using this model:
Conrad,
C.P., and C. Lithgow-Bertelloni, Faster seafloor spreading and lithosphre
production during the mid-Cenozoic, Geology, 35, 29-32, 2007. [online version] [reprint] [highlight in Nature]